Trying to Save Connects Is Costing You Money
Every freelancer on Upwork learns the same reflex. Connects cost money, so you spend them carefully. You skip the job asking for 16 Connects and take two shots at the ones asking for 8.
That reflex is backwards, and it is expensive.
I looked at 513,129 public Upwork job postings observed between 27 February and 13 August 2026, each one carrying the number of Connects required to submit a proposal. That is the subset of what we observed where a Connects figure was captured, roughly three quarters of it, so the counts here are smaller than the totals in our monthly market reports. The pattern is not subtle. Upwork prices Connects by how valuable the contract is likely to be. So the jobs that cost the least to bid on are cheap for a reason: they are worth the least, and more than half of them come from clients who have not attached a payment method.
Conserving Connects does not save you money. It selects the worst work in the feed.
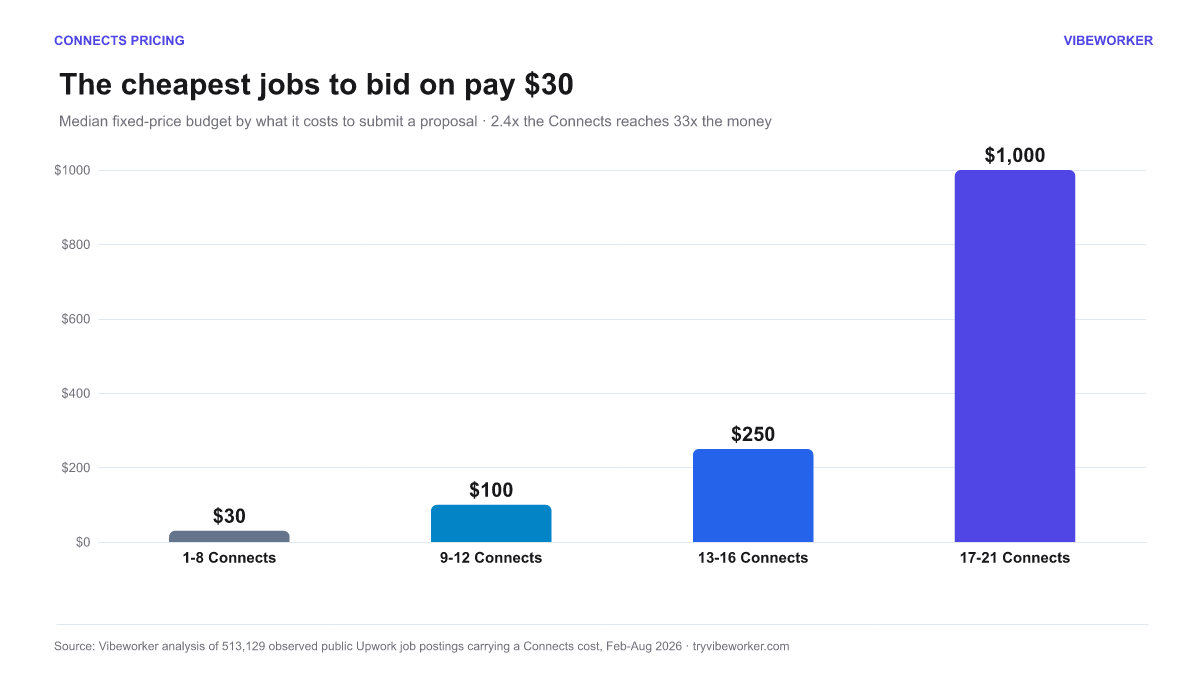
The cheapest jobs to bid on pay $30
Here is the whole argument in one chart. Fixed-price postings, grouped by what it costs to submit a proposal, against the median budget in each group.
| Connects to bid | Postings | Median budget |
|---|---|---|
| 1 to 8 | 68,368 | $30 |
| 9 to 12 | 92,694 | $100 |
| 13 to 16 | 30,591 | $250 |
| 17 to 21 | 12,257 | $1,000 |
The jobs at the bottom of the Connects range have a median budget of thirty dollars. The jobs at the top have a median budget of a thousand.
Going from the cheapest band to the most expensive costs about 2.6 times the Connects. It reaches roughly 33 times the money.
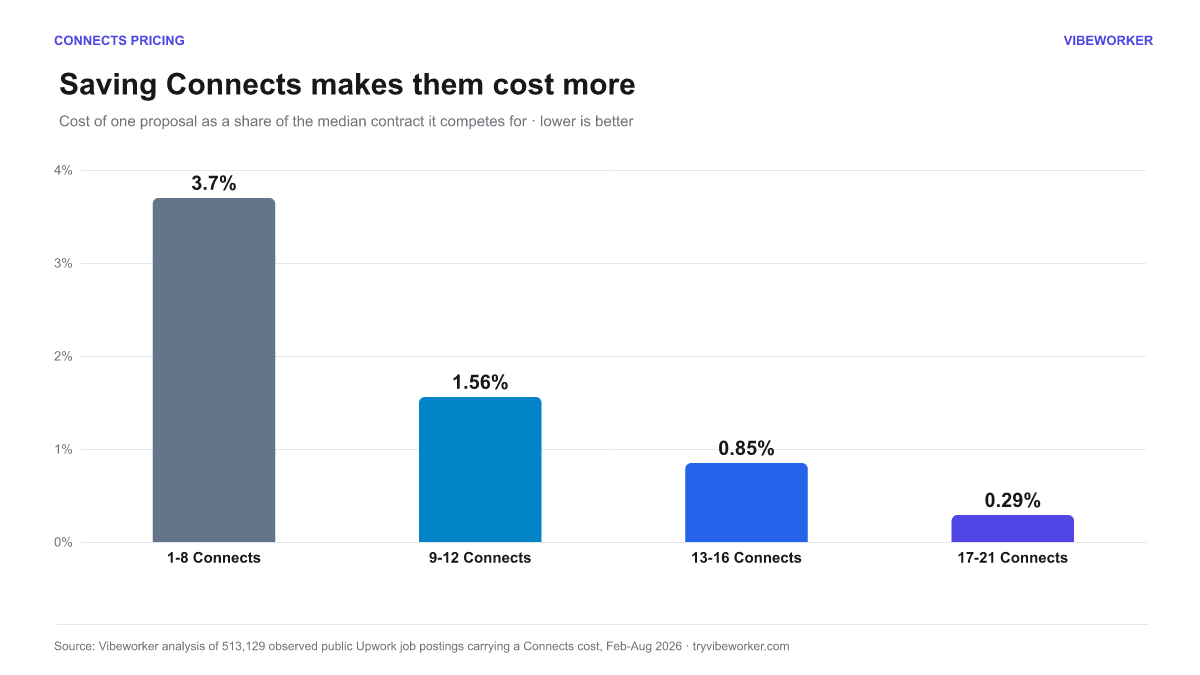
Saving Connects makes them cost more
The number that actually matters is not what a proposal costs. It is what a proposal costs relative to the contract you are competing for.
At Upwork's list price of $0.15 per Connect, a proposal in the cheapest band costs about $1.11 and competes for a median $30 job. A proposal in the most expensive band costs about $2.85 and competes for a median $1,000 job.
| Connects to bid | Cost per proposal | Median contract | Cost as % of contract |
|---|---|---|---|
| 1 to 8 | $1.11 | $30 | 3.7% |
| 9 to 12 | $1.56 | $100 | 1.56% |
| 13 to 16 | $2.12 | $250 | 0.85% |
| 17 to 21 | $2.85 | $1,000 | 0.29% |
Bidding in the cheap band costs you nearly 13 times more in Connects for every dollar of contract you are chasing.
The cheap jobs are the expensive ones. They just charge you in a currency you were not counting.
"But the big jobs take longer"
This is the first sensible objection, and the data answers it.
Each posting in the corpus carries an effort estimate, which is a model's read of how many hours the described work would realistically take. Dividing the median budget by the average estimate gives an effective hourly rate for each band.
| Connects to bid | Median budget | Avg estimated hours | Effective hourly |
|---|---|---|---|
| 1 to 8 | $30 | 23.1 | $1.30 |
| 9 to 12 | $100 | 33.3 | $3.00 |
| 13 to 16 | $250 | 44.2 | $5.66 |
| 17 to 21 | $1,000 | 69.9 | $14.31 |
Yes, the expensive jobs are bigger. They are roughly three times the work. They are also eleven times better paid per hour.
The cheap band is not a smaller version of the same work. It is a different and worse deal.
Why the cheap jobs are cheap
Upwork is not pricing Connects randomly, and it is not pricing by category. It is pricing a bundle of signals that all point at the same thing: how likely this contract is to be worth something.
Every dimension moves the same direction.
| Signal | Cheap end | Expensive end |
|---|---|---|
| Payment method verified | not verified: 8.19 | verified: 13.10 |
| Client lifetime spend | $0: 9.35 | $100k+: 15.13 |
| Contract duration | under 1 month: 9.68 | over 6 months: 14.08 |
| Hours per week | under 30: 12.60 | over 30: 15.79 |
| Experience level | entry: 10.69 | expert: 13.48 |
| Contract type | fixed: 10.46 | hourly: 13.35 |
Average Connects required, by signal.
The single strongest lever is payment verification. A posting from a client who has not verified a payment method costs an average of 8.19 Connects. One from a verified client costs 13.10, about 60% more.
The most expensive postings in the entire corpus, the ones asking 21 Connects, are almost entirely one profile: hourly, more than 30 hours a week, expert or intermediate level, from a client with a verified payment method. The five-Connect floor is the mirror image: short, cheap, one-time, unverified.
What the cheap band actually buys you
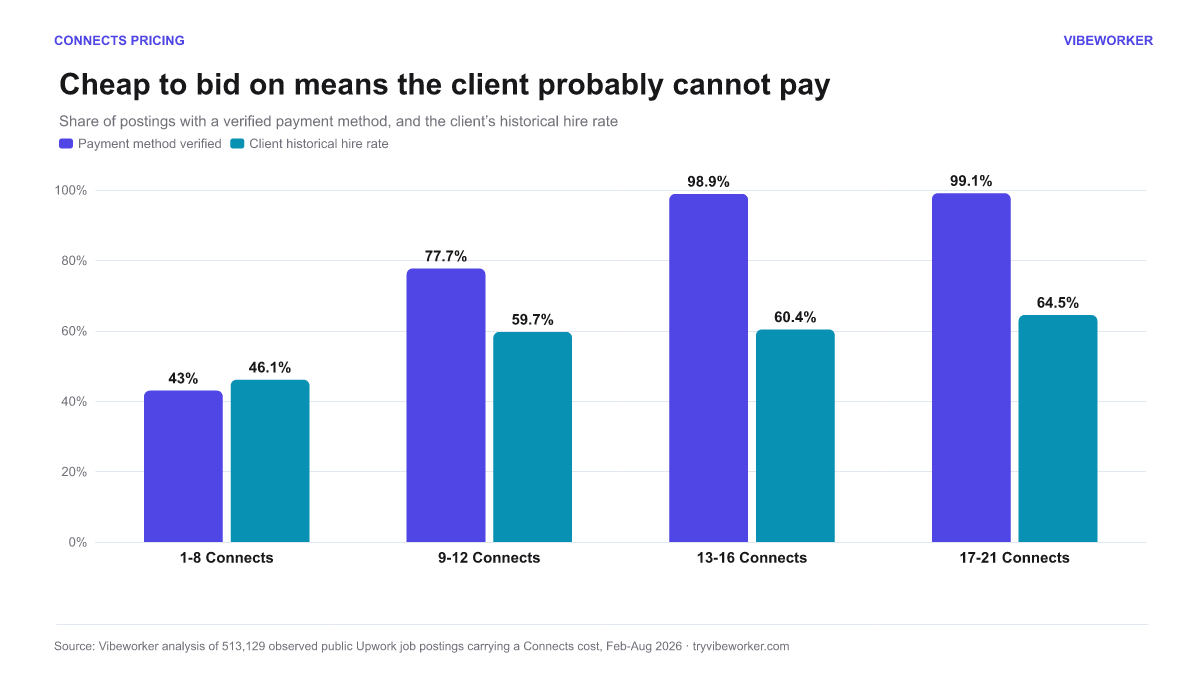
If Connects cost tracks contract quality, then the cheap band should be visibly worse on every quality measure. It is.
| Connects to bid | Payment verified | Client hire rate | Red-flag score |
|---|---|---|---|
| 1 to 8 | 43.0% | 46.1% | 6.56 |
| 9 to 12 | 77.7% | 59.7% | 7.45 |
| 13 to 16 | 98.9% | 60.4% | 7.78 |
| 17 to 21 | 99.1% | 64.5% | 7.44 |
Red-flag score is 0 to 10 where higher is cleaner.
Fifty-seven percent of the cheapest postings to bid on come from clients with no verified payment method. At the top of the range, that figure is under one percent.
Those clients also hire less. The average client posting in the cheap band has historically hired for 46% of their postings. In the top band it is 64.5%. Payment verification and hire history are two of the signals covered in more detail in Client Red Flags: Avoid Wasting Time and Money on Upwork.
So the trade you make when you conserve Connects is this: you pay a little less, to compete for far less money, from a client who is markedly less likely to have a payment method and markedly less likely to hire anyone at all.
The price has not gone up
One more thing worth putting on the record, because it contradicts something widely believed.
The cost of a proposal has not risen. Across six months the average has barely moved.
| Month | Postings | Avg Connects |
|---|---|---|
| March 2026 | 59,939 | 12.05 |
| April 2026 | 33,597 | 11.92 |
| May 2026 | 111,593 | 11.96 |
| June 2026 | 127,605 | 11.86 |
| July 2026 | 126,515 | 11.91 |
| August 2026 | 48,286 | 11.94 |
Those rows sum to 507,535 rather than 513,129. The remaining 5,594 are 5,592 postings where no reliable posting date was captured, plus 2 from the final days of February. They are included in every other figure in this article and excluded only from this table, which needs a month to group by.
April is also visibly light at 33,597 against May's 111,593. That reflects our collection coverage in April, not a collapse in Upwork postings. It does not affect the figure this table is about, which is an average per posting rather than a count.
Flat, within a fifth of a Connect, for half a year.
If bidding feels more expensive than it used to, the price per proposal is not why. What changed is how many proposals you need to send to get the same result, which is a competition problem rather than a pricing one. Posting volume itself has grown: 161,102 postings in July, up 26% from June.
What to do with this
Read the Connects cost as a signal, not a tax. It is the closest thing Upwork gives you to a public quality score on a posting, and it is visible before you spend anything. A job asking 18 Connects is telling you something about the client on the other end.
Be suspicious of cheap. Not because cheap is always bad, but because 57% of it comes from clients who have not attached a payment method. If you are going to bid in that band, check payment verification and hire history first. Those are free to look at.
Stop counting proposals sent. The metric that matters is Connects spent per contract won, and it is dominated by which jobs you choose rather than how many you apply to. We cannot measure win rates from postings, so this is a claim about the value of what you are competing for rather than your odds of getting it. But ten proposals into the top band cost less in total than thirty into the bottom, and they compete for thirty times the money.
Buy fewer, better lottery tickets. That is the whole thing.
If you want the wider context on what the feed looks like, the July 2026 market report covers budget distribution, effective hourly pay, and category mix across 161,102 postings.
Method and caveats
The corpus is 513,129 public Upwork job postings observed between 27 February and 13 August 2026, each carrying a Connects requirement. Figures are computed over that set unless stated otherwise. The budget analysis uses fixed-price postings with a stated budget, which is 203,910 of them. Connects values in the corpus run from 5 to 21 with no postings outside that range.
Some honest limits:
This measures postings, not outcomes. It describes what was advertised and what the client's history looked like at the time. It does not track proposals sent, contracts awarded, or final negotiated pay. The client hire rate is Upwork's own historical figure for that client, not a measurement of the specific posting.
Effort estimates are model-generated. The effective hourly figures rest on an automated read of how long the described work would take. Treat them as a consistent yardstick across bands rather than a precise number for any individual job.
Connects pricing is Upwork's list price of $0.15 each. Freelancers who buy in bundles or receive free monthly Connects will have a different unit cost. The ratios between bands do not change.
One finding runs against the grain and is worth stating. Scope clarity, our score for how precisely a posting defines the deliverable, is slightly worse in the expensive bands: 5.96 out of 10 in the cheapest band against 5.17 in the most expensive. Larger contracts tend to be described more loosely. That is a real risk on big jobs and an argument for pinning down scope before you start, not an argument for bidding cheap.
Win probability is the missing term, and it is the biggest limitation here. The argument is about cost per dollar of contract chased. It is not a complete expected-value calculation, because that would need the odds of actually winning, and the corpus carries no proposal or applicant counts. There is an obvious hypothesis that cuts against the conclusion: if Upwork prices Connects by desirability, the expensive postings may attract proportionally more proposals, which would narrow the advantage. We cannot measure that, so treat the recommendation to bid higher up the range as directional rather than proven. What is measured, and stands regardless, is that the cheap band pays less per hour and is dominated by clients who have not verified a payment method.
Supply is finite, though less so than the fixed-price figures suggest. Across the full corpus the top band holds 95,696 postings, roughly 570 a day globally across every category. That is not scarce in absolute terms, but filtered to one person's skills, language, and timezone it may not be enough to fill a pipeline on its own. Most freelancers will work a mix. The point is not to bid exclusively at the top, it is to stop treating the bottom as the efficient choice.
Observation is not exhaustive. These are postings Vibeworker observed, not the entirety of Upwork.
The underlying data for each chart is published as CSV, linked in the metadata above. If you want to check the arithmetic, please do.
Related: Upwork Connects explained, Upwork fees explained.

Michael Watkins
Founder of Vibeworker. Helping freelancers win the Upwork game through speed and data.
Stop missing the jobs that matter
Vibeworker watches the Upwork feed and alerts you the moment a high-fit job appears — before the proposals pile up.
Get started free →Keep reading
The Upwork Job Market in July 2026: 161,102 Postings, Analyzed
A data report on 161,102 public Upwork job postings observed in July 2026: budget distribution, effective hourly pay, experience-level demand, AI-tool mentions, and category mix.
The Upwork Job Market in June 2026: 127,607 Postings, Analyzed
A data report on 127,607 public Upwork job postings observed in June 2026: budget distribution, effective hourly pay, experience-level demand, AI-tool mentions, and category mix.
The Best Time to Find Upwork Jobs, Based on 142,122 Postings
We analyzed 142,122 public Upwork job postings by weekday and hour. Wednesday was the busiest day, while posting volume peaked at 16:00 UTC.