The Upwork Job Market in June 2026: 127,607 Postings, Analyzed
Vibeworker observed 127,607 deduplicated public Upwork job postings in June 2026. That is roughly 4,250 new jobs a day, or one every 20 seconds, around the clock.
This report describes what those postings looked like: how they paid, what experience level clients asked for, which AI tools they named, and which categories carried the volume. It measures postings, not outcomes—not proposals sent, contracts awarded, or final negotiated pay.
The headline is the pay. Fixed-price work made up the largest single share of the feed, and most of it clustered at the bottom of the budget range.
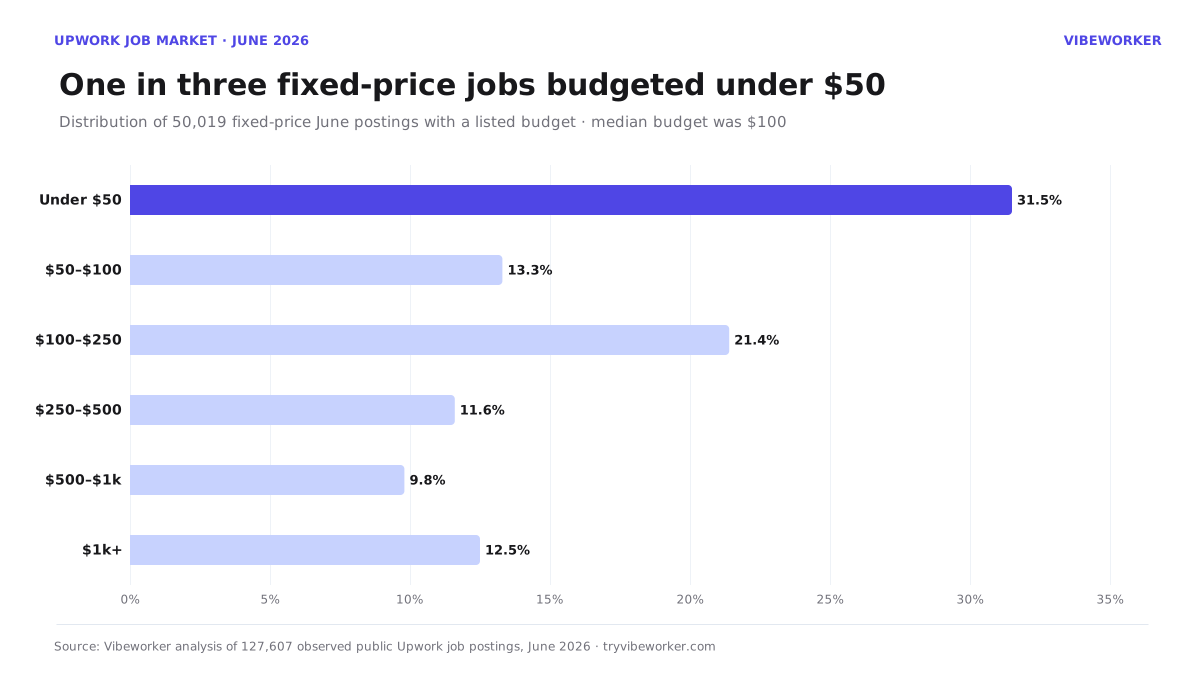
Most fixed-price jobs budgeted under $250
Of June's postings, 50,019 were fixed-price with a listed budget, 49,099 were hourly, and the remainder did not specify a type. Among the fixed-price jobs, the median budget was $100.
| Budget band | Jobs | Share |
|---|---|---|
| Under $50 | 15,738 | 31.5% |
| $50–$100 | 6,644 | 13.3% |
| $100–$250 | 10,707 | 21.4% |
| $250–$500 | 5,783 | 11.6% |
| $500–$1,000 | 4,907 | 9.8% |
| $1,000+ | 6,240 | 12.5% |
Nearly a third of fixed-price postings budgeted under $50, and two-thirds came in under $250. Jobs at $500 or more—the band where a project can pay for meaningful time—made up 22.3% of the fixed-price feed.
Budget alone understates the problem, because a low budget attached to a large task is worse than a low budget attached to a small one. Dividing each fixed-price budget by Vibeworker's LLM estimate of the hours the job would take gives an effective hourly rate. The median fixed-price job in June worked out to about $8.75 an hour. That is a listed-budget figure, not completed-contract pay, and budgets are often negotiable—but it is what clients placed in front of applicants.
Clients asked for experience they were not budgeting for
The experience tier clients selected did not match the pay they attached. Across June postings with an experience level set:
| Experience level | Jobs | Share |
|---|---|---|
| Intermediate | 85,926 | 67.4% |
| Expert | 31,069 | 24.4% |
| Entry level | 10,541 | 8.3% |
Only about one posting in twelve was labeled Entry level. Roughly two-thirds asked for Intermediate talent, and a quarter asked for Experts—while the median fixed budget across the whole feed sat at $100. For a freelancer building a profile, the takeaway is structural: the market openly asks for experience far more often than it pays for a beginner to gain it. Experience level is a weak standalone filter; scope, listed pay, and client history say more.
AI-tool demand cooled, with one exception
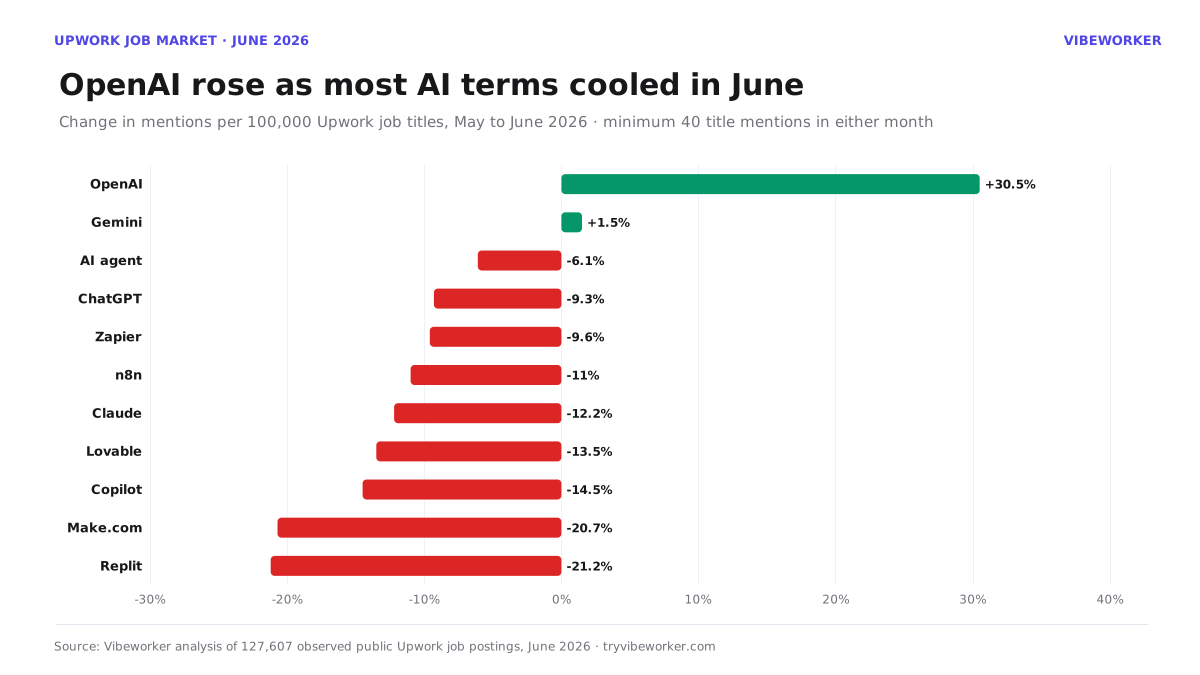
Vibeworker tracks how often specific AI and automation tools appear in job titles, normalized per 100,000 postings so that month-to-month volume changes do not distort the comparison. In June, nearly every tracked term declined from its May rate.
| Tool | May per 100k | June per 100k | Change |
|---|---|---|---|
| OpenAI | 67.9 | 88.6 | +30.5% |
| Gemini | 34.0 | 34.5 | +1.5% |
| AI agent | 287.1 | 269.6 | −6.1% |
| ChatGPT | 64.8 | 58.8 | −9.3% |
| Zapier | 147.4 | 133.2 | −9.6% |
| n8n | 318.7 | 283.7 | −11.0% |
| Claude | 493.9 | 433.4 | −12.2% |
| Make.com | 175.9 | 139.5 | −20.7% |
OpenAI was the clear mover, up 30.5% in title mentions. Gemini was flat, and everything else slipped. Two results stand out. Claude remained the single most-named AI tool in Upwork titles despite easing to 433 mentions per 100,000, and n8n stayed the most-named automation platform ahead of Zapier and Make.com. And Make.com, which had more than doubled from April to May, gave back a fifth of its rate in June—a reminder that a single strong month is not a trend.
The chart and table apply a minimum threshold of 40 raw title mentions in at least one month, so a term moving from three mentions to six is not shown as triple-digit growth.
Marketing and creative work carried the volume
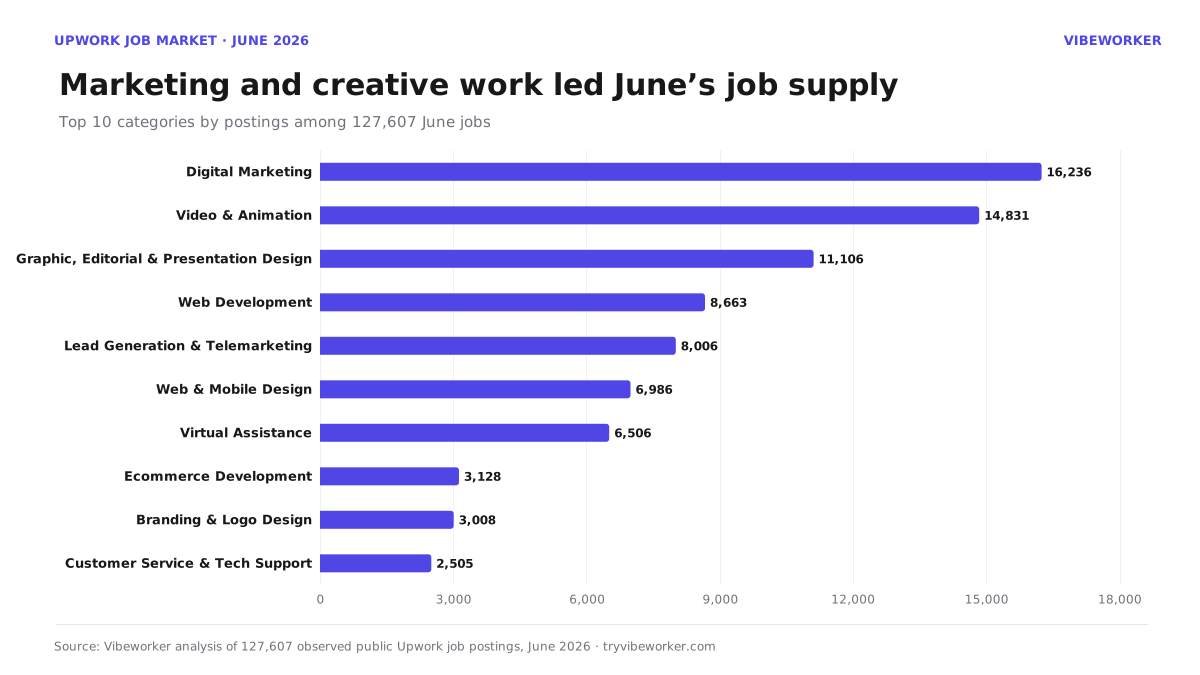
Job supply was not concentrated in software. The largest categories were marketing, video, and design.
| Category | Jobs | Share |
|---|---|---|
| Digital Marketing | 16,236 | 12.7% |
| Video & Animation | 14,831 | 11.6% |
| Graphic, Editorial & Presentation Design | 11,106 | 8.7% |
| Web Development | 8,663 | 6.8% |
| Lead Generation & Telemarketing | 8,006 | 6.3% |
| Web & Mobile Design | 6,986 | 5.5% |
| Virtual Assistance | 6,506 | 5.1% |
The top three categories were all marketing or creative, together accounting for roughly a third of all postings. Web Development, the largest technical category, ranked fourth.
One more signal: a quarter of clients had not verified payment
Payment verification is one of the cheapest quality checks a freelancer can make before spending connects. In June, 24.0% of postings came from clients whose payment method was not verified. Separately, 4.8% of scored postings tripped Vibeworker's red-flag screen (a score of 3 or below out of 10), which flags signals like vague scope, unrealistic budgets, and demanding-but-underpaid combinations.
What the month says
June's feed was large, fast, and bottom-heavy. The volume is real—one posting every 20 seconds—but most of it sits below the rates that make an hour of work worthwhile, and clients ask for experience more readily than they pay for it. For a freelancer, the practical consequence is that speed of reading matters as much as speed of applying: the jobs worth a proposal are a minority of what gets posted, and finding them quickly is most of the work.
Later reports
Methodology
Vibeworker analyzed 127,607 deduplicated public Upwork job postings observed from June 1 through June 30, 2026 UTC. Deduplication keeps one record per job.
Budget statistics use postings with a usable positive displayed budget; records without one were excluded from pay calculations. The effective hourly rate divides a posting's listed fixed budget by an LLM estimate of the hours the job would require, and is a listed-value figure rather than completed-contract pay. Experience-level shares use postings with a level set. AI-tool rates use literal case-insensitive title matches, are normalized per 100,000 postings, and are not mutually exclusive. Red-flag rates use Vibeworker's intrinsic per-job scoring.
This dataset covers postings observed by Vibeworker and should not be presented as an official Upwork census. It does not measure proposals, contracts awarded, final negotiated pay, or freelancer earnings.
Reuse and citation
You may quote these findings and republish the charts for editorial use. Please credit Vibeworker and link to this article as the original source. Charts may be resized but should not otherwise be modified.
Journalists working on a story can request a custom data cut — a specific category, date range, or metric not covered here — at no cost. Email mike@tryvibeworker.com with your outlet and press credentials.
Suggested citation: "Vibeworker, The Upwork Job Market in June 2026, July 2026."
Download the full dataset (JSON) → All reports and data studies: Upwork statistics.
Vibeworker tracks new Upwork jobs and sends you a notification the second one matches what you're looking for. Get started free →

Michael Watkins
Founder of Vibeworker. Helping freelancers win the Upwork game through speed and data.
Stop missing the jobs that matter
Vibeworker watches the Upwork feed and alerts you the moment a high-fit job appears — before the proposals pile up.
Get started free →Keep reading
The Upwork Job Market in September 2026: 116,224 Postings, Analyzed
A data report on 116,224 public Upwork job postings observed in September 2026: budget distribution, effective hourly pay, experience-level demand, AI-tool mentions, posting times and category mix.
The Upwork Job Market in August 2026: 133,354 Postings, Analyzed
A data report on 133,354 public Upwork job postings observed in August 2026: budget distribution, effective hourly pay, experience-level demand, AI-tool mentions, posting times and category mix.
The Upwork Job Market in July 2026: 161,102 Postings, Analyzed
A data report on 161,102 public Upwork job postings observed in July 2026: budget distribution, effective hourly pay, experience-level demand, AI-tool mentions, and category mix.