The Upwork Job Market in August 2026: 133,354 Postings, Analyzed
Vibeworker observed 133,354 deduplicated public Upwork job postings in August 2026. That is about 4,300 new jobs a day, or one every 20.1 seconds: about 4,900 on an average weekday and 3,000 on an average weekend day.
This report describes what those postings looked like: how they paid, what experience level clients asked for, which AI tools they named, when they were posted and which categories carried the volume. It measures postings, not outcomes: not proposals sent, contracts awarded or final negotiated pay. The most recent month is in the September 2026 report.
The short version
- Median fixed-price budget: $100. Median effective hourly rate on fixed-price work: $8.33.
- 37.5% of fixed-price jobs budgeted under $50. 18.8% budgeted $500 or more.
- 45.6% of postings were hourly, 44.9% fixed-price and the rest did not specify.
- 9.2% of postings asked for Entry level talent. Intermediate was 65.2%, Expert 25.6%.
- 31.7% came from clients without a verified payment method.
- Copilot and "AI agent" gained the most title mentions from July. Make.com fell the most. Claude was still the most-named AI tool.
- Postings peaked between 15:00 and 18:00 UTC (11 a.m. to 2 p.m. US Eastern).
Fixed-price budgets: over a third under $50
Of August's postings, 59,929 were fixed-price with a listed budget, 60,772 were hourly and 12,653 did not specify a type. Among the fixed-price jobs, the median budget was $100.
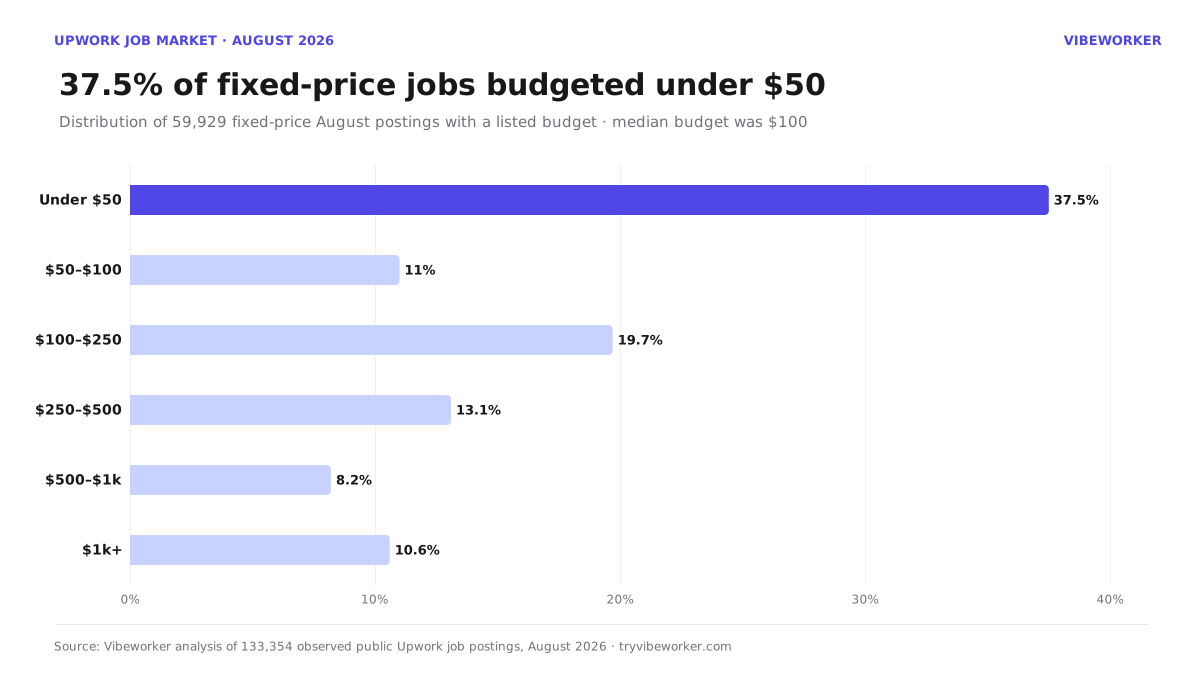
| Budget band | Jobs | Share |
|---|---|---|
| Under $50 | 22,470 | 37.5% |
| $50–$100 | 6,568 | 11.0% |
| $100–$250 | 11,800 | 19.7% |
| $250–$500 | 7,831 | 13.1% |
| $500–$1,000 | 4,889 | 8.2% |
| $1,000+ | 6,371 | 10.6% |
37.5% of fixed-price postings budgeted under $50, and almost half (48.5%) were under $100. At the other end, 18.8% budgeted $500 or more: about 11,300 jobs in the month, or roughly 360 a day.
Dividing each fixed-price budget by Vibeworker's estimate of the hours the job would take gives an effective hourly rate. The median fixed-price job in August worked out to about $8.33 an hour. That is a listed-budget figure, not completed-contract pay, and budgets are often negotiable, but it is what clients put in front of applicants.
Clients asked for experience far more than for beginners
Across August postings with an experience level set:
| Experience level | Jobs | Share |
|---|---|---|
| Intermediate | 76,338 | 65.2% |
| Expert | 29,988 | 25.6% |
| Entry level | 10,750 | 9.2% |
Fewer than one posting in ten was labeled Entry level, and about nine in ten asked for Intermediate or Expert talent. Most of the feed is written for someone with a track record, which is why first reviews usually come from small, well-scoped jobs. See the entry-level delusion, visualized.
Copilot and AI agents gained; Make.com fell hardest
Vibeworker tracks how often specific AI and automation tools appear in job titles, normalized per 100,000 postings so the comparison is not distorted by how many postings were observed each month.
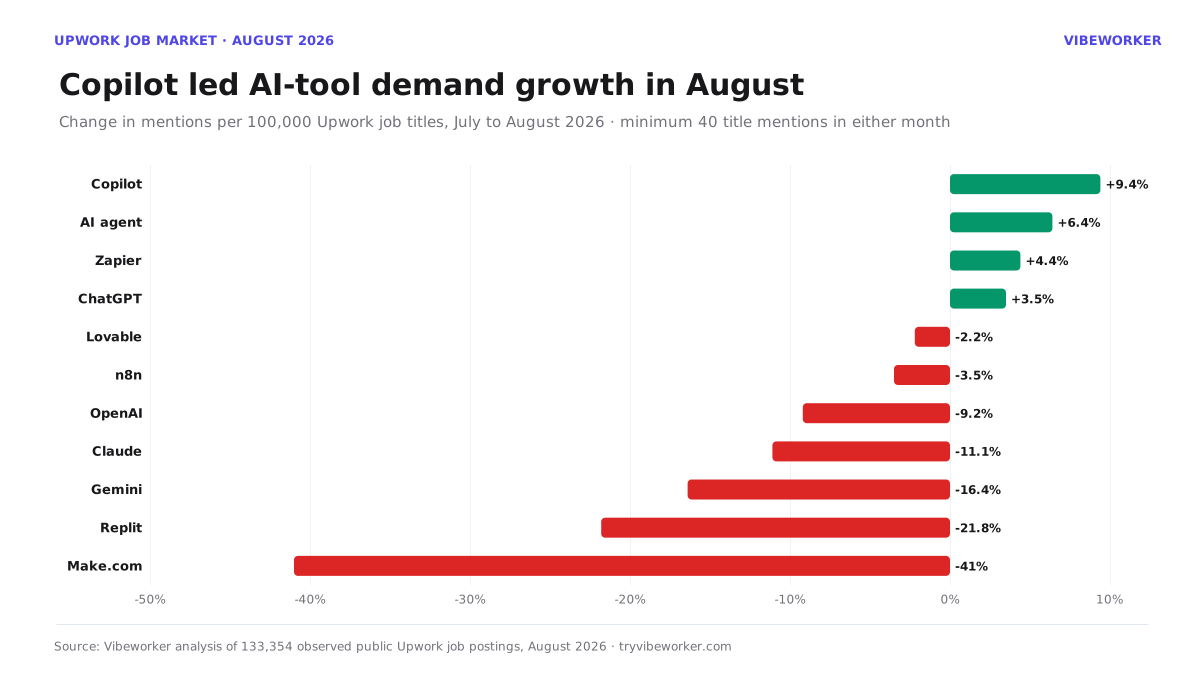
| Tool | July per 100k | August per 100k | Change |
|---|---|---|---|
| Copilot | 32.9 | 36.0 | +9.4% |
| AI agent | 255.1 | 271.5 | +6.4% |
| Zapier | 86.9 | 90.7 | +4.4% |
| ChatGPT | 73.9 | 76.5 | +3.5% |
| Lovable | 78.2 | 76.5 | −2.2% |
| n8n | 262.6 | 253.5 | −3.5% |
| OpenAI | 82.6 | 75.0 | −9.2% |
| Claude | 383.0 | 340.4 | −11.1% |
| Gemini | 38.5 | 32.2 | −16.4% |
| Replit | 33.5 | 26.2 | −21.8% |
| Make.com | 108.0 | 63.7 | −41.0% |
Copilot and "AI agent" gained the most. Make.com lost about two-fifths of its July rate, and most model names (Claude, OpenAI, Gemini) eased. Even so, Claude remained the most-named AI tool in Upwork titles (454 mentions, 340 per 100,000), and n8n stayed the most-named automation platform, well ahead of Zapier and Make.com.
The table only includes terms with at least 40 title mentions in one of the two months, so a term going from 10 mentions to 15 is not shown as 50% growth.
When jobs are posted
August postings followed the US working day. The four busiest hours were 15:00 to 18:00 UTC, each carrying about 5.4% of the day's postings, which is 11 a.m. to 2 p.m. US Eastern. The quietest hours were 03:00 and 04:00 UTC, at about 2.9% each.
Weekdays averaged about 4,900 postings and weekend days about 3,000. Because jobs arrive all day, the best time of day to apply is less about one hour and more about being early on each job.
Digital Marketing and Video & Animation led August
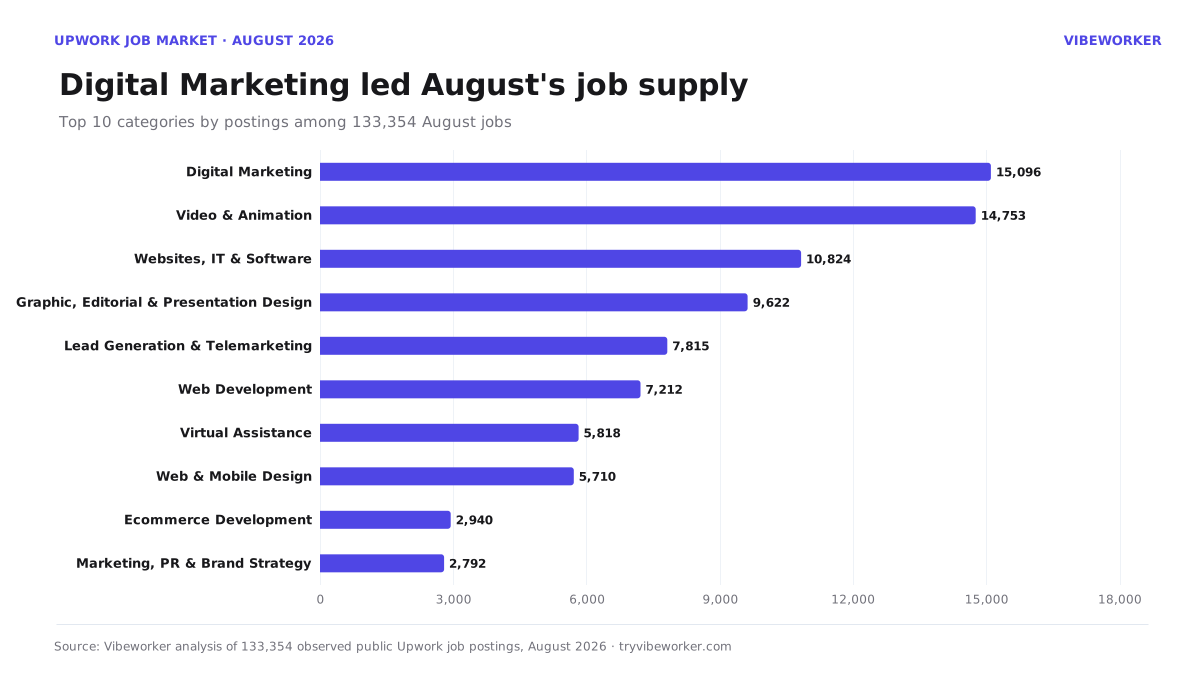
| Category | Jobs | Share |
|---|---|---|
| Digital Marketing | 15,096 | 11.3% |
| Video & Animation | 14,753 | 11.1% |
| Websites, IT & Software | 10,824 | 8.1% |
| Graphic, Editorial & Presentation Design | 9,622 | 7.2% |
| Lead Generation & Telemarketing | 7,815 | 5.9% |
| Web Development | 7,212 | 5.4% |
| Virtual Assistance | 5,818 | 4.4% |
Digital Marketing and Video & Animation together made up over a fifth of postings, with software and web work next. For where the competition is thinner, see Upwork job categories with the least competition.
Client signals
In August, 31.7% of postings came from clients whose payment method was not verified, close to one in three. What the verified payment badge actually tells you covers why that matters before spending Connects. Separately, 5.6% of scored postings tripped Vibeworker's red-flag screen (a score of 3 or below out of 10).
What the month says
August's feed was mostly small jobs, with about 360 fixed-price jobs a day at $500 or more and a large hourly share. Clients asked for experience far more often than for beginners, and close to a third of postings came from clients without verified payment. In AI work, the gains went to "AI agent" and Copilot while Make.com fell sharply. The practical point for a freelancer is the same every month: most of the feed is not worth a proposal, so filtering quickly and applying early matter more than reading everything.
Other reports
- The Upwork job market in September 2026
- The Upwork job market in July 2026
- The Upwork job market in June 2026
Methodology
Vibeworker analyzed 133,354 deduplicated public Upwork job postings observed from August 1 through August 31, 2026 UTC. Deduplication keeps one record per job.
Budget statistics use fixed-price postings with a usable positive listed budget. The effective hourly rate divides a posting's listed fixed budget by an LLM estimate of the hours the job would require, and is a listed-value figure rather than completed-contract pay. Experience-level shares use postings with a level set. AI-tool rates use literal case-insensitive title matches, are normalized per 100,000 postings, and are not mutually exclusive. Red-flag rates use Vibeworker's per-job scoring. Posting times use each job's posting timestamp in UTC.
Counts describe the postings Vibeworker observed and are not a census of all Upwork jobs, so compare months by shares and rates rather than raw totals. Category labels follow the categories attached to each posting. The dataset does not measure proposals, contracts awarded, final negotiated pay or freelancer earnings.
Reuse and citation
You may quote these findings and republish the charts for editorial use. Please credit Vibeworker and link to this article as the original source. Charts may be resized but should not otherwise be modified.
Journalists working on a story can request a custom data cut (a specific category, date range or metric not covered here) at no cost. Email mike@tryvibeworker.com with your outlet and press credentials.
Suggested citation: "Vibeworker, The Upwork Job Market in August 2026, September 2026."
Download the full dataset (JSON) →
Vibeworker watches new Upwork jobs and alerts you within minutes when one matches your filters, so you can be early on the few that are worth a proposal. Try Vibeworker free →

Michael Watkins
Founder of Vibeworker. Helping freelancers win the Upwork game through speed and data.
Stop missing the jobs that matter
Vibeworker watches the Upwork feed and alerts you the moment a high-fit job appears — before the proposals pile up.
Get started free →Keep reading
The Upwork Job Market in September 2026: 116,224 Postings, Analyzed
A data report on 116,224 public Upwork job postings observed in September 2026: budget distribution, effective hourly pay, experience-level demand, AI-tool mentions, posting times and category mix.
The Upwork Job Market in July 2026: 161,102 Postings, Analyzed
A data report on 161,102 public Upwork job postings observed in July 2026: budget distribution, effective hourly pay, experience-level demand, AI-tool mentions, and category mix.
The Upwork Job Market in June 2026: 127,607 Postings, Analyzed
A data report on 127,607 public Upwork job postings observed in June 2026: budget distribution, effective hourly pay, experience-level demand, AI-tool mentions, and category mix.